Type: Interactive Web Map / Proportional Symbol Map
The world is going interactive, so does the map!
This is the first interactive web map I completed in my interactive cartography class.
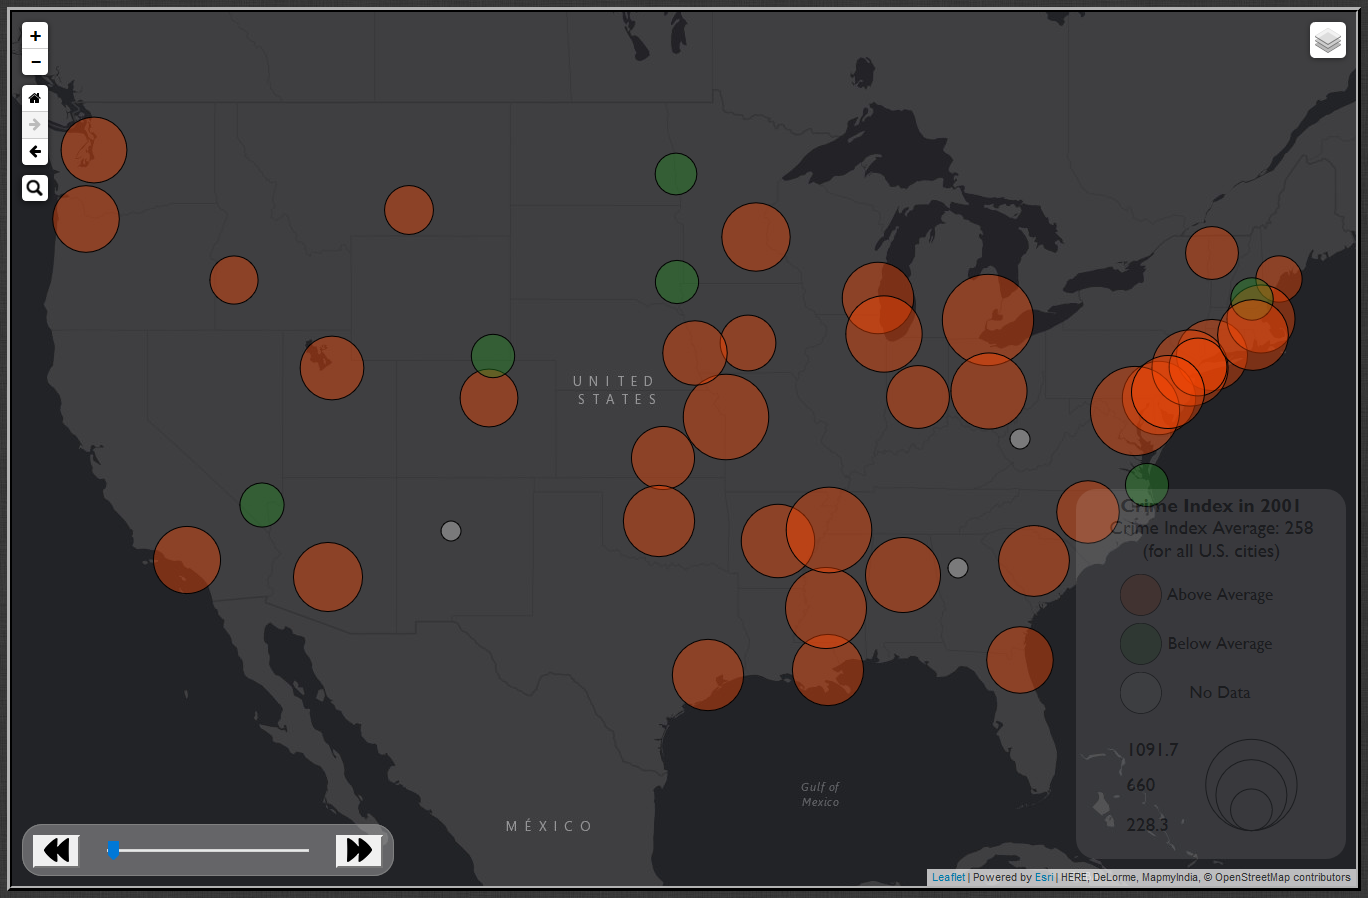
The map can provide users ceratin interface freedom to accomplish tasks such as zooming and panning, searching displayed cities, switching basemaps, playing time-series animation, etc. By sequencing through the crime index changes of the cities from 2001 to 2015, the map may provide users certain insights on how to construct a healthier and safer urban environment.
Tools Used: HTML / CSS, JavaScript / jQuery, Leaflet
Please click the image below to experience the interactivity! Note: better viewed in 20.8in * 17.7in PC screen.